


When employees miss important updates or don’t respond, managers usually notice first. The problem comes back as reminders, repeated messages, individual follow-up, and extra work.
2026 Employee Engagement Benchmarks
| Benchmark | Latest figure |
|---|---|
| U.S. employees engaged, H1 2026 | 31% |
| U.S. employees actively disengaged, H1 2026 | 18% |
| Employees engaged globally, 2025 | 20% |
| Global managers engaged, 2025 | 22% |
| U.S. employees receiving recognition or praise in the past 7 days, May 2026 | 29% |
| U.S. employees who say their opinions count at work, May 2026 | 26% |
| Estimated global productivity lost to low engagement, 2025 | ~$10 trillion |
Sources: Gallup’s July 2026 U.S. engagement update; State of the Global Workplace 2026; Employee Engagement Indicator.
We wanted to see how engagement-related operational issues show up in the businesses we work with, where managers are responsible for keeping communication and daily work moving.
We analyzed customer conversations from 451 companies between June 1 and August 28, 2026. One conversation couldn’t be classified, so sample-wide percentages use 450 companies as the denominator.
About our data: Gallup measures employee engagement as workers’ psychological attachment to their work, team, and employer. Our research did not survey employees or calculate engagement scores. We analyzed company conversations for engagement-related operational issues, including communication, employee response, onboarding, manager workload, and work consequences.
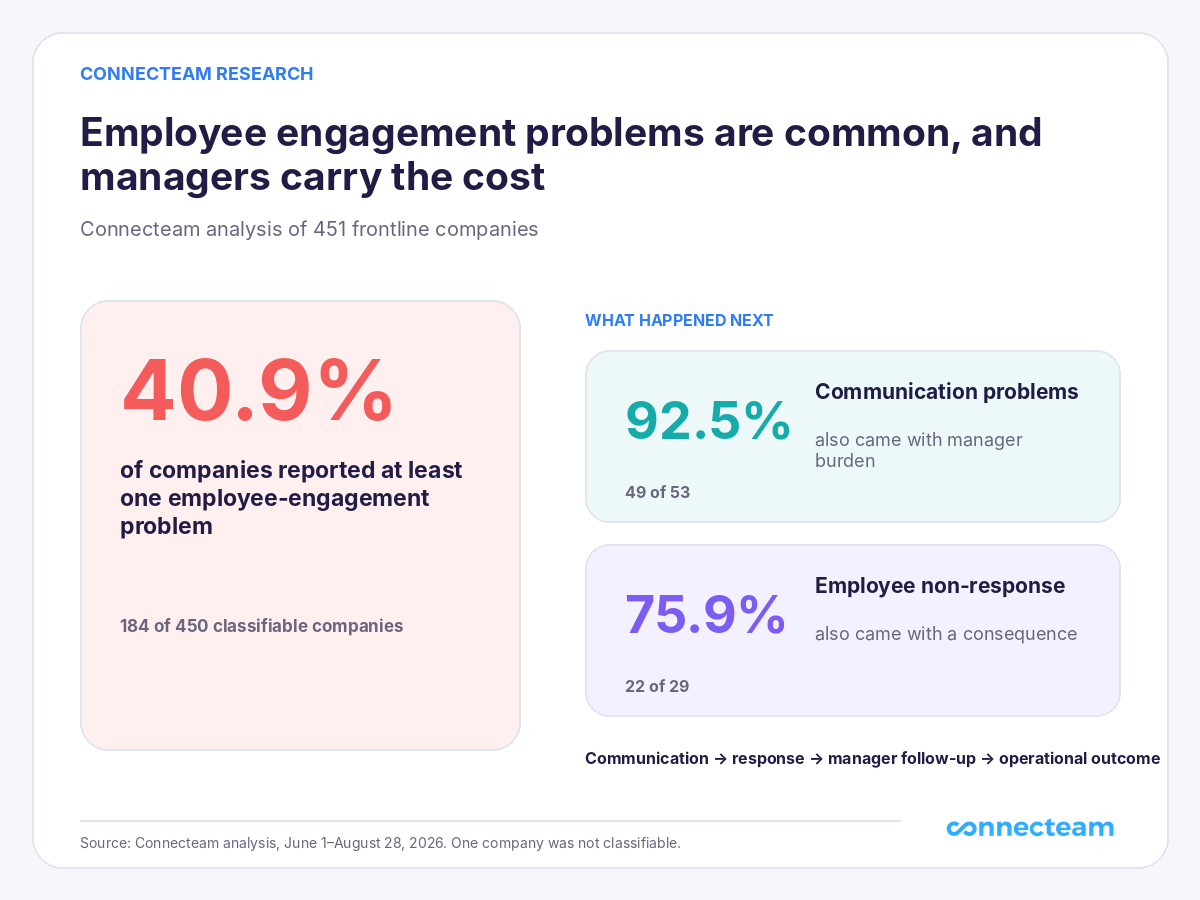
40.9% of the 450 classified company conversations contained at least one engagement-related operational issue under our coding framework.
Communication was the most common specific issue we coded. The strongest co-occurrence was with manager workload: among the 53 conversations where we coded a communication breakdown, 49 also contained evidence of additional manager burden, or 92.5%.
Key Employee Engagement-Related Statistics From Our Research
- 40.9% of the 450 classified company conversations contained at least one engagement-related operational issue under our coding framework.
- 49 of 53 conversations with communication breakdowns also contained evidence of additional manager burden (92.5%).
- 22 of 29 conversations with employee non-response also included a concrete consequence (75.9%).
- 29 of 53 conversations with communication breakdowns also included a concrete consequence (54.7%).
- 11.8% of classified conversations contained communication or information-flow breakdowns.
- 8.4% of classified conversations contained onboarding gaps.
The first figure shows how often engagement-related issues surfaced in the conversations we analyzed. The subgroup figures show which coded issues appeared together in the same conversations.
Communication Problems Often Appeared Alongside More Manager Work
11.8% of classified company conversations contained communication or information-flow breakdowns, making communication the most common specific engagement-related issue we coded.
Managers described information not reliably reaching employees, messages going unread, and difficulty knowing whether staff had received important updates.
The more striking number is what happened alongside those problems.
Among the 53 conversations where we coded a communication breakdown, 49 also contained evidence of additional manager burden.
That’s 92.5%.
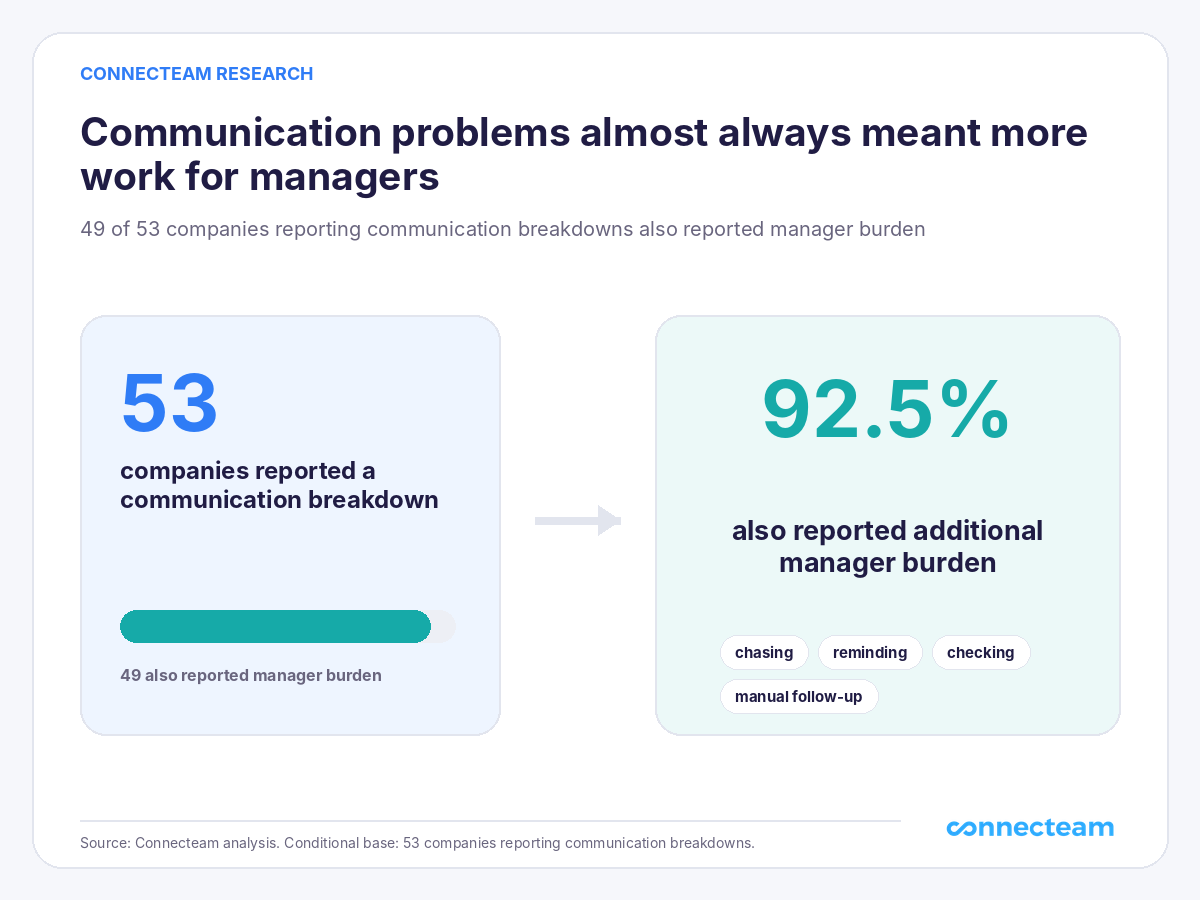
Across the 450 classified conversations, 10.2% included managers repeatedly chasing or reminding employees, while 10.0% included extra manual work because employees weren’t responding or participating. These groups overlap, so the percentages shouldn’t be added together.
The extra work was familiar manager work: checking whether someone saw an update, sending another reminder, repeating information, or stepping in when the normal process didn’t work.
In day-to-day operations, manager follow-up was one of the clearest ways an engagement-related issue became operational.
Employee Non-Response Often Appeared With Concrete Consequences
Communication can reach an employee without getting a response.
6.4% of classified conversations contained examples of employees not responding to or acknowledging messages. The percentage itself is modest. What appeared alongside those examples is more revealing.
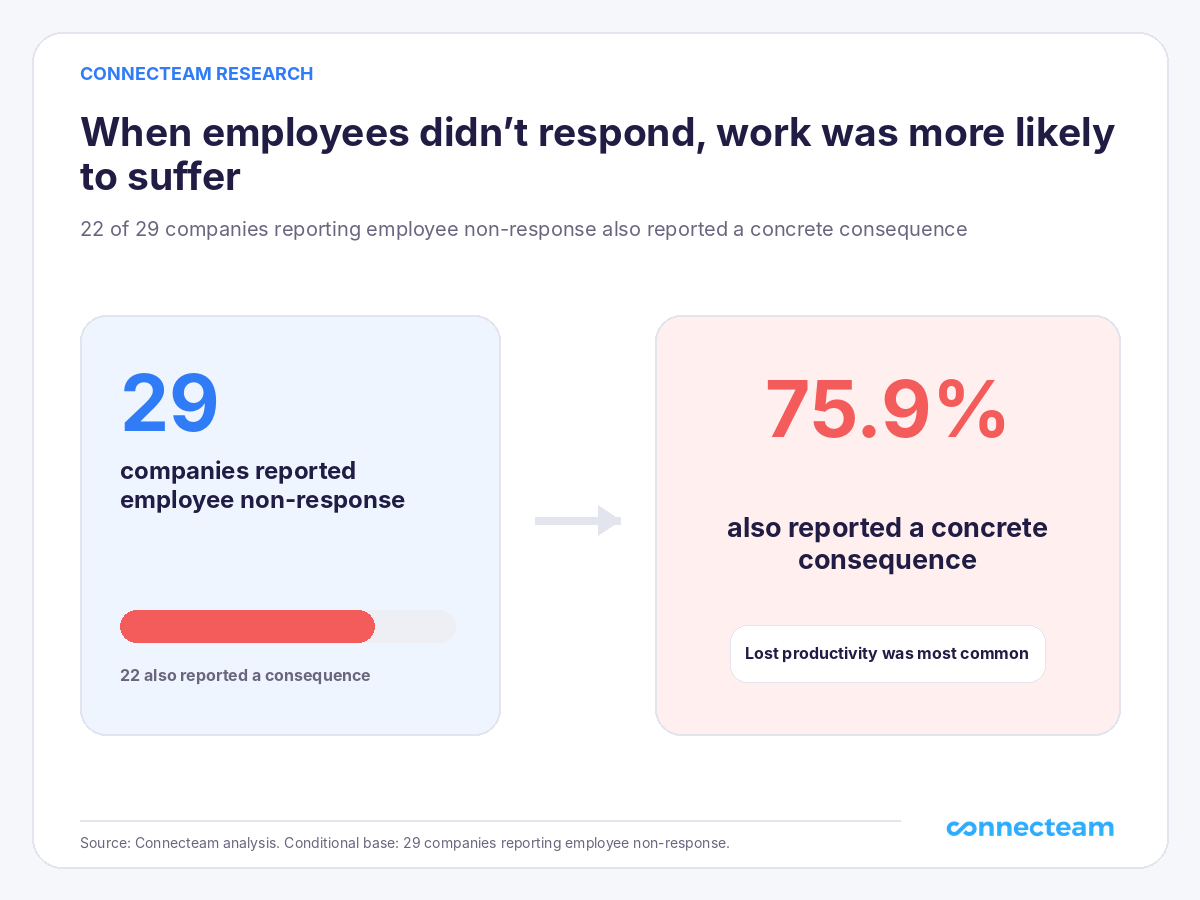
Among the 29 conversations where we coded employee non-response, 22 also included a concrete consequence.
That’s 75.9%.
Lost productivity was the most common consequence, appearing in 18 of those companies.
Communication problems showed a similar pattern. Among the 53 conversations where we coded a communication breakdown, 29 also included a concrete consequence, or 54.7%.
Lost productivity was again the most common, appearing in 21 of those 53 companies.
Across the 450 classified conversations, 7.6% included lost productivity tied to an engagement-related issue.
Gallup estimates the global productivity cost of low engagement at around $10 trillion. Our research shows a narrower operational pattern: missed information and employee non-response often appeared alongside additional manager work and lost productivity in the conversations we analyzed.
Onboarding Was Another Common Engagement-Related Issue
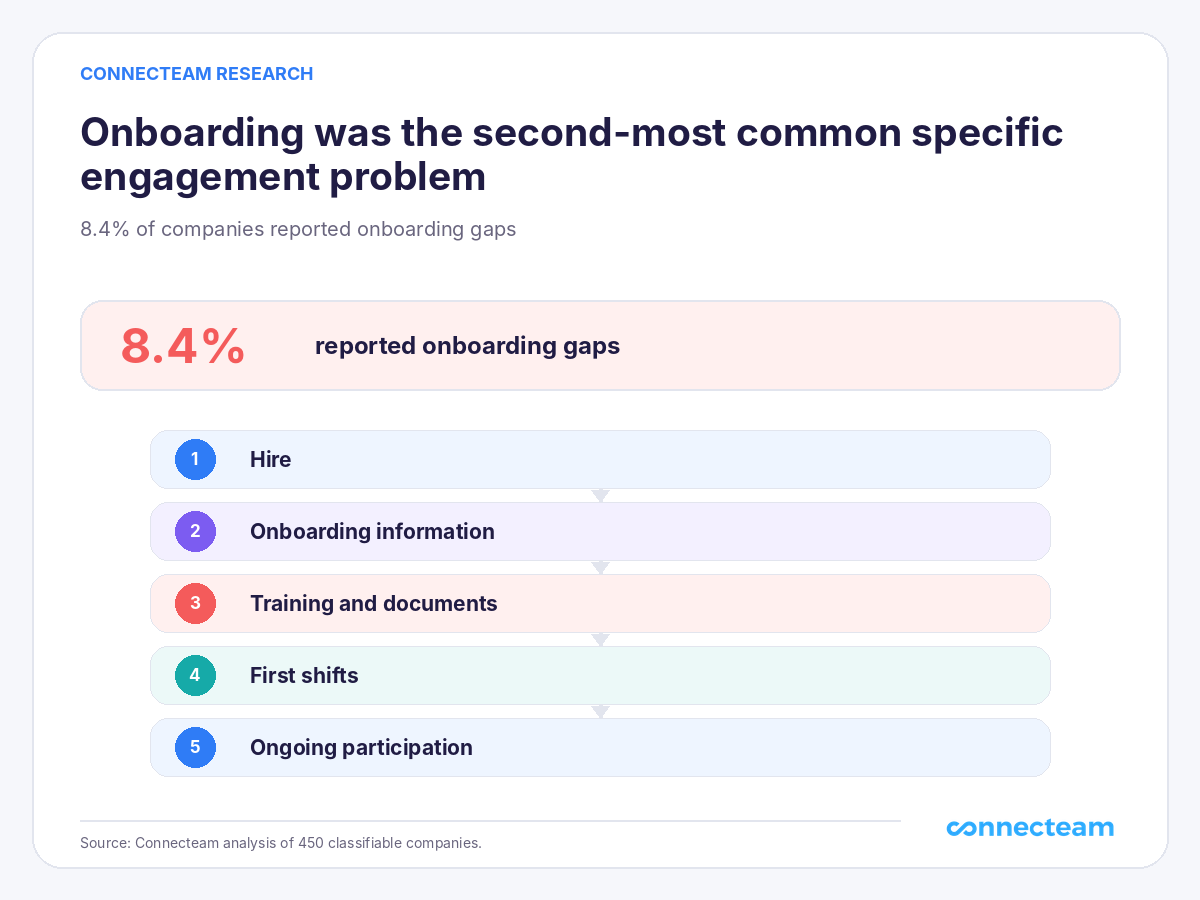
8.4% of classified conversations contained onboarding gaps, making onboarding the second-most common specific engagement-related issue we coded.
The problems were practical: new employees starting without all the information they needed, incomplete onboarding steps, inconsistent processes, and managers having to follow up.
Another 2.4% of classified conversations contained ongoing training or development gaps, but onboarding itself was the clearer signal.
Onboarding shapes how new hires first learn what’s expected, how the company communicates, and where to find the information they need to work.
What These Engagement-Related Issues Look Like in Practice
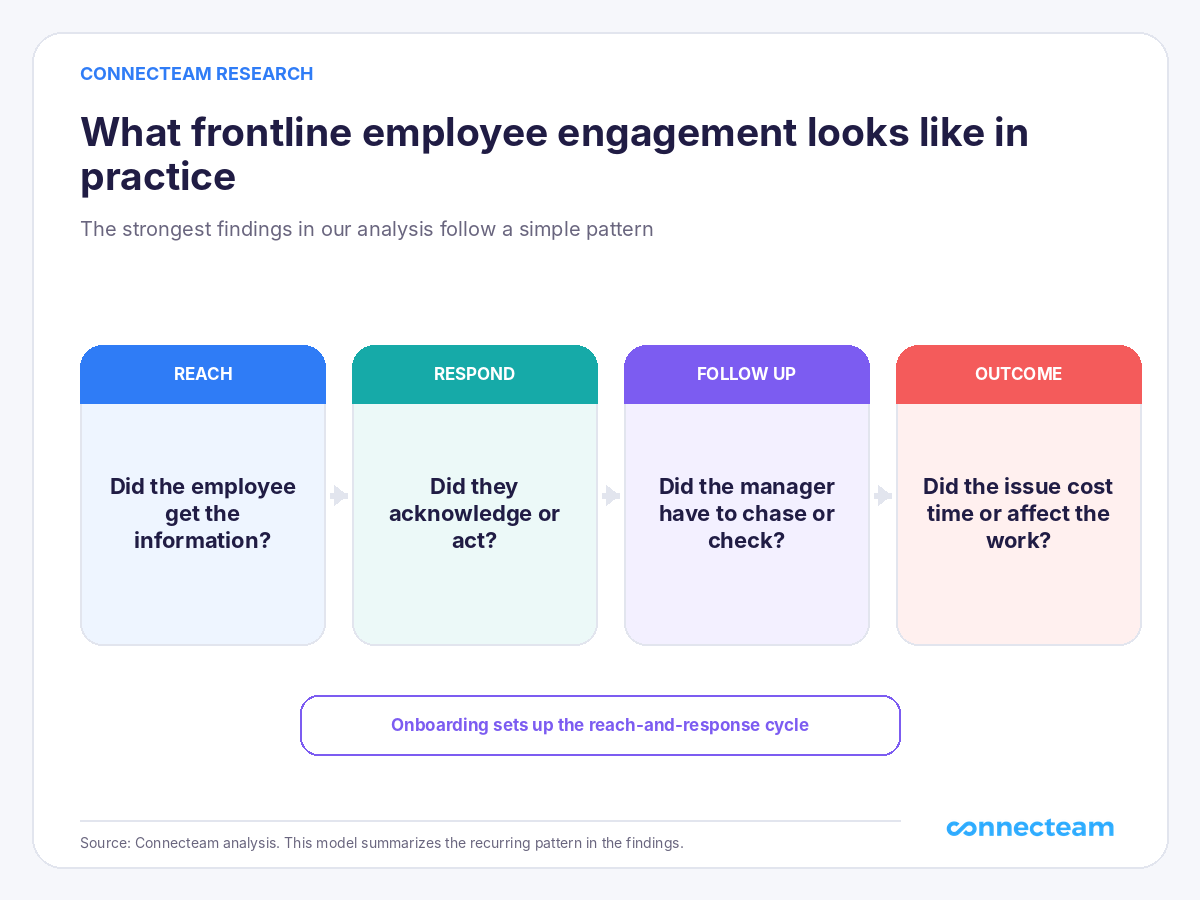
Across the conversations, a recurring operational pattern was:
Reach → Respond → Follow up → Outcome
- Reach: Did the employee get the information?
- Respond: Did they acknowledge it or act?
- Follow up: Did the manager have to chase, remind, or check?
- Outcome: Did the problem start costing time or affecting the work?
Onboarding sits at the beginning. It gives employees their first information, expectations, processes, and connection to the company.
This gives managers a practical way to spot engagement-related friction.
A sent message isn’t the end of the process. Look at whether employees receive it and respond. If managers routinely have to chase people or compensate manually, that follow-up is part of the engagement picture too.
How Connecteam Helps With the Operational Issues We Found
The biggest issues in our research were getting information to employees, knowing whether they responded, reducing repeated follow-up, and giving new hires a clear start.
| What our research found | How Connecteam helps |
|---|---|
| Information doesn’t reliably reach employees | Send targeted Updates and use Team Chat for frontline communication. |
| Managers don’t know who saw an update | See who viewed an Update and check message read status. |
| Managers spend time chasing employees | Identify who still needs a reminder instead of checking with everyone. |
| Onboarding is inconsistent | Assign onboarding packs and track each new hire’s progress. |
| Employees need information after it has been shared | Keep policies, SOPs, and other resources in a mobile Knowledge Base. |
Reach employees and see who got the message
Connecteam’s communications tools give frontline teams one place for work messages instead of relying on scattered texts, email, and informal conversations. Explore Connecteam’s employee communication tools
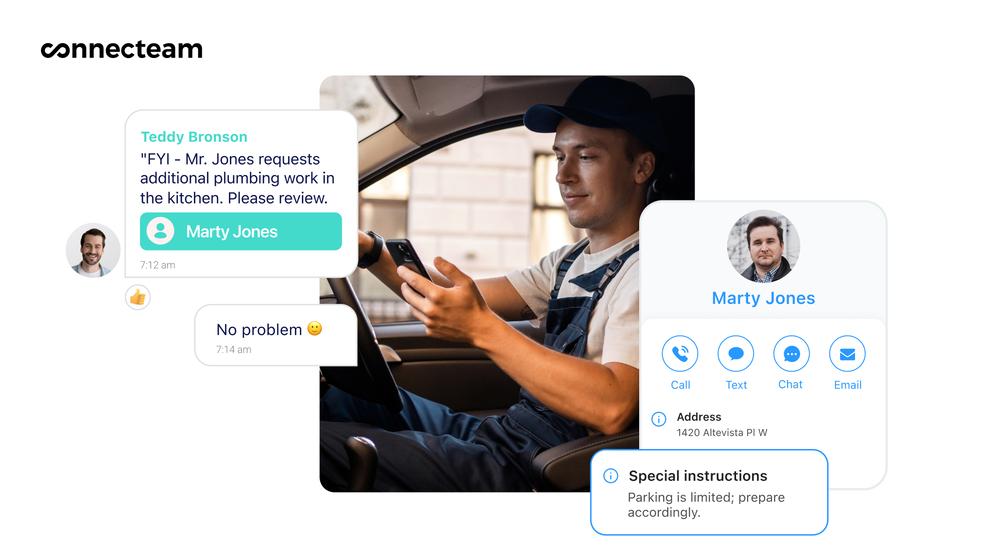
With Updates, managers can send information to specific employees or groups and see who viewed the post. They can then follow up with employees who haven’t seen it.
Team Chat supports direct, group, and one-way communication, with read status for messages.
That turns a broad “Did everyone see this?” follow-up into a much smaller list of people who actually need a reminder.
Give new hires a clear onboarding process
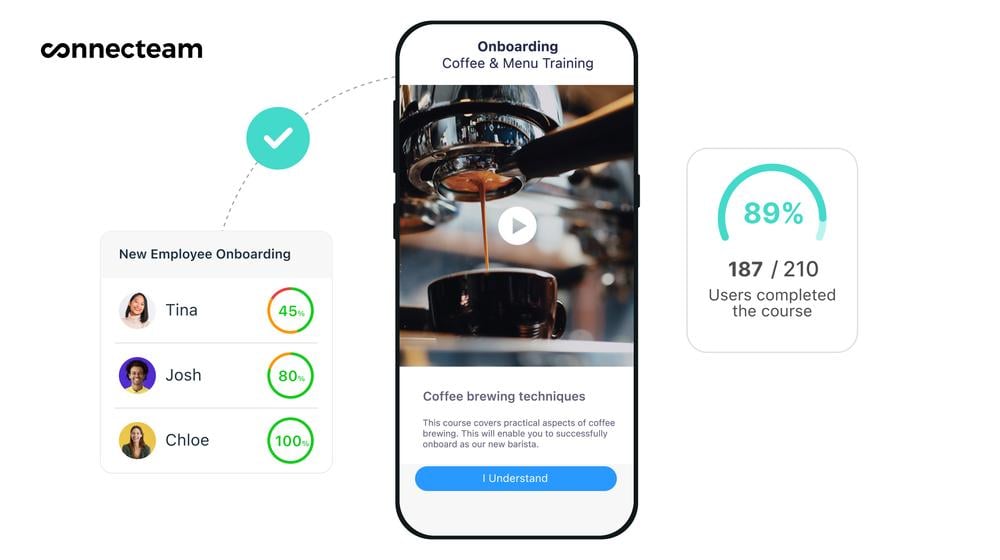
Connecteam’s Hiring & Onboarding tools let managers collect new-hire information, assign onboarding steps, and track progress from one place. Explore Connecteam Hiring & Onboarding
Managers can see which onboarding steps are complete instead of tracking the process through separate emails, documents, and reminders.
Give employees somewhere to find information themselves
Connecteam’s Knowledge Base gives employees mobile access to policies, SOPs, manuals, and other company resources. Explore Connecteam Knowledge Base
Employees can access those resources from their phones instead of asking a manager to resend the same information.
Try Connecteam for free today!
Methodology
Connecteam analyzed anonymized sales and customer-success conversations from 451 unique companies between June 1 and August 28, 2026.
The sample was randomly selected at the company level, with one conversation per company. One conversation couldn’t be classified, leaving 450 companies in the statistical analysis.
Only customer, owner, and manager statements were counted. Connecteam rep statements were excluded.
We coded customer statements for communication and information flow, employee responsiveness, onboarding and development, manager burden, and consequences tied to engagement-related issues. Ordinary scheduling, timekeeping, payroll, paperwork, GPS, and other workforce-management issues were excluded unless the customer explicitly connected them to an engagement-related issue. One conversation could receive multiple codes.
Sample-wide percentages use the 450 classified companies as the denominator. Subgroup findings use the relevant coded conversations, which is why we show the underlying counts alongside percentages such as 49 of 53 and 22 of 29. These are co-occurrence findings, not proof that one issue caused another.
These conversations weren’t conducted as an employee-engagement survey, and we did not calculate employee engagement scores. The research shows which engagement-related operational issues surfaced while companies discussed their operations with Connecteam. A missing code means an issue did not surface in that conversation, not that the company did not experience it. Companies may experience additional issues that weren’t discussed, and categories can overlap. The sample was not designed to represent employers in any specific country.
Employee Engagement Statistics FAQs
Gallup found that 31% of U.S. employees were engaged at work in the first half of 2026, while 18% were actively disengaged. Globally, the latest engagement rate is 20%, based on 2025 data.
Among the 450 classified conversations, communication or information-flow breakdowns were the most common specific engagement-related issue, appearing in 11.8%. Onboarding gaps appeared in 8.4%, while employee non-response appeared in 6.4%.
Among the 53 conversations where we coded a communication breakdown, 49 also contained evidence of additional manager burden, or 92.5%. The extra work included chasing employees, sending reminders, checking whether information was received, and doing extra manual work.
Among the 53 conversations where we coded a communication breakdown, 29 also included a concrete consequence, or 54.7%, most often lost productivity. Across all 450 classified conversations, 7.6% included lost productivity tied to an engagement-related issue.
Onboarding shapes how employees receive information, understand expectations, and learn how work gets done. In Connecteam’s analysis, onboarding gaps appeared in 8.4% of classified conversations, making onboarding the second-most common specific engagement-related issue we coded.
