


Organizational charts clarify the chain of command, streamline communication, and boost efficiency.
But, creating one can be tricky—it’s time-consuming and finicky to format.
Luckily, there’s software for that. Below, we show you how to build an organizational chart in Word and Excel and introduce you to something even better: specialized org chart software.
Key Takeaways
- Organizational charts clarify your company’s roles, hierarchy, and lines of authority.
- There are several types of organizational charts, including traditional, matrix, and flat charts.
- Many companies use Microsoft Word and Excel to build their org charts, but these aren’t easy to scale and must be manually updated.
- Modern software like Connecteam automatically updates your org chart based on any new or removed employees or changes in roles.
What Is an Organizational Chart?
An organizational chart is a visual representation of the internal structure of a company. It outlines the lines of authority, responsibilities, and relationships between individuals and groups within the organization.
An org chart is designed to provide a clear picture of the hierarchy that connects everyone—from top executives to middle management to entry-level employees.
For example, in a typical corporate organizational chart, you might see the CEO at the top, followed by vice presidents, managers, and staff members who report to them—each connected by lines that represent their reporting lines.
Key components of an organizational chart
So, what is an organizational chart made up of? Org charts include:
- Boxes: Each box (sometimes called a “card”) on an org chart represents a particular person within the organization and houses all key information, such as the employees’ names, job titles, and teams or departments.
- Lines: Boxes are linked to each other via lines that show reporting relationships or the chain of command within the company.
- Levels: Charts are organized into different levels that illustrate the hierarchy of the company, with upper levels typically representing senior positions and lower levels representing junior roles.
- Formatting: Org charts can be color-coded or formatted in bold to differentiate between departments, functional areas, geographical locations, or seniority levels.
Who uses an organizational chart?
Here are some primary organizational chart users.
- Human resources (HR) rely on these charts to manage employee relationships, performance reviews, recruitment and onboarding, compensation decisions, and learning and development.
- Company leaders use org charts to understand organizational structures, learn about who’s in their purview, and ensure clear communication across departments and levels.
- Team, line, and project managers use the chart to manage workflows, understand reporting lines, and learn where their people fit within the larger organization.
- New employees rely on org charts to learn who’s who in the company, identify key stakeholders, and understand the company’s hierarchy.
Why Do You Need an Organizational Chart?
Here’s why your company needs an organizational chart.
Clarifies lines of communication and authority
An org chart visually represents your company’s internal structure and reporting lines. This helps new and existing employees learn about the different departments and company leaders, who reports to whom, where they can go for information and approvals, and how they fit into the larger picture. This clarity helps to streamline processes, reduce errors, and save time.
Helps with talent management and allocation of resources
Managers and HR team members can use org charts to understand the different roles, responsibilities, and departments in the company. They can also use them to identify any staffing gaps or overstaffing issues—and use these insights to make hiring and restructuring decisions.
Organization charts can also help HR and leaders in succession planning, plus in spotting and addressing risks (such as one manager overseeing too many teams). And execs can use these charts to test out different org structures during strategic planning sessions.
Streamlines training, onboarding, performance, and more
HR and managers can use org charts to understand who oversees which employees. For instance, recruitment would know where a new joiner fits into the company and set up relevant introductory meetings with the hiring manager, department head, and so on.
Additionally, HR can easily see which managers are accountable for overseeing performance reviews and compensation decisions for the company’s employees, ensuring these crucial processes aren’t missed.
Did You Know?
Apps like Connecteam not only let you build an org chart but also have tools to streamline communication and HR management.
Types of Organizational Charts and Where They’re Used
Org charts come in various forms, each suited to different operational needs and internal structures. Here are some of the most common types of organizational charts and when they’re typically used.
| Type | Description | Best for |
| Hierarchical org chart | This is the most popular and traditional org chart. It starts with the highest authority—for instance, the CEO or President—at the top, followed by senior execs, middle managers, and junior employees. Employees are connected by solid lines to their managers. | Any company with complex layers and hierarchies benefits from this type of org chart. Large organizations that need a clear representation of the chain of command. |
| Matrix org chart | Here, employees may report to multiple managers—for example, a project manager or staffer—usually because they’re part of more than one functional area. Employees are linked to their direct line managers (if they have one) by solid lines and to their “matrix” (additional) managers with dotted lines. | Fluid companies that work on a project or client basis—for instance, consulting, banking, or tech—where employees get staffed on different projects or clients. Smaller companies where employees wear multiple hats and work across multiple business areas and departments. |
| Flat or horizontal org chart | This chart has few or no levels of middle management between employees and senior leaders. Each executive typically has multiple staff members reporting directly to them, depicted by a solid reporting line. | Smaller businesses and startups with few employees who are managed by executives.Companies that favor quick and decentralized decision-making. |
| Divisional org chart | This is similar to the traditional org chart, but each business area or location has its own senior leaders, middle managers, and employees. | Large businesses or multinational corporations with multiple product lines, geographical locations, etc.—which can’t be easily represented in a single org chart. |
| Network org chart | This type of org chart shows relationships inside and outside the company. Employees, managers, contractors, and freelancers are depicted in circles—not boxes—and are connected to each other through dotted lines. | Businesses that rely heavily on outsourcing or contractual work and need a clear way to show who works with whom and which internal team members are responsible for holding external parties accountable. |
How To Build an Organizational Chart
To create an organizational chart, first, gather all the necessary and up-to-date information about your company’s employees, such as names and job titles, departmental divisions, and reporting lines. You’ll need this data to create your org chart.
Pro Tip
Consider using employee database software to record and manage your team’s data. This way, you can easily find updated information for your org chart.
Next, define the type of organizational chart that best suits your company’s internal structure—for instance, traditional or matrix.
Finally, consider the tools you’ll use to create your org chart. Before the digital age, companies drew their org charts using paper and pen, but today, many companies use basic software like Microsoft Word or Excel to simplify the process.
Here’s how to build an organizational chart in Word and Excel.
How to build an organizational chart in Word
Follow these steps to build an organizational chart in Word.
Step 1: Open Microsoft Word
Word should open a blank document by default, but if it’s taken you to a previous document, click on File > New Document. Alternatively, open the existing document in which you want to create your org chart by clicking on File > Open.
Step 2: Use the SmartArt tool
Click on the Insert tab located on the top bar. Then, find the SmartArt button and click it to see the SmartArt graphics menu. Look for the Hierarchy graphic and hover over it to view all hierarchical chart types.
Step 3: Select your organizational chart type
Choose the org chart style that suits your needs. You can pick between a traditional hierarchy chart, a horizontal chart, and more. Click OK once you’ve made your selection. For this demo, we’ve selected the traditional hierarchical chart.
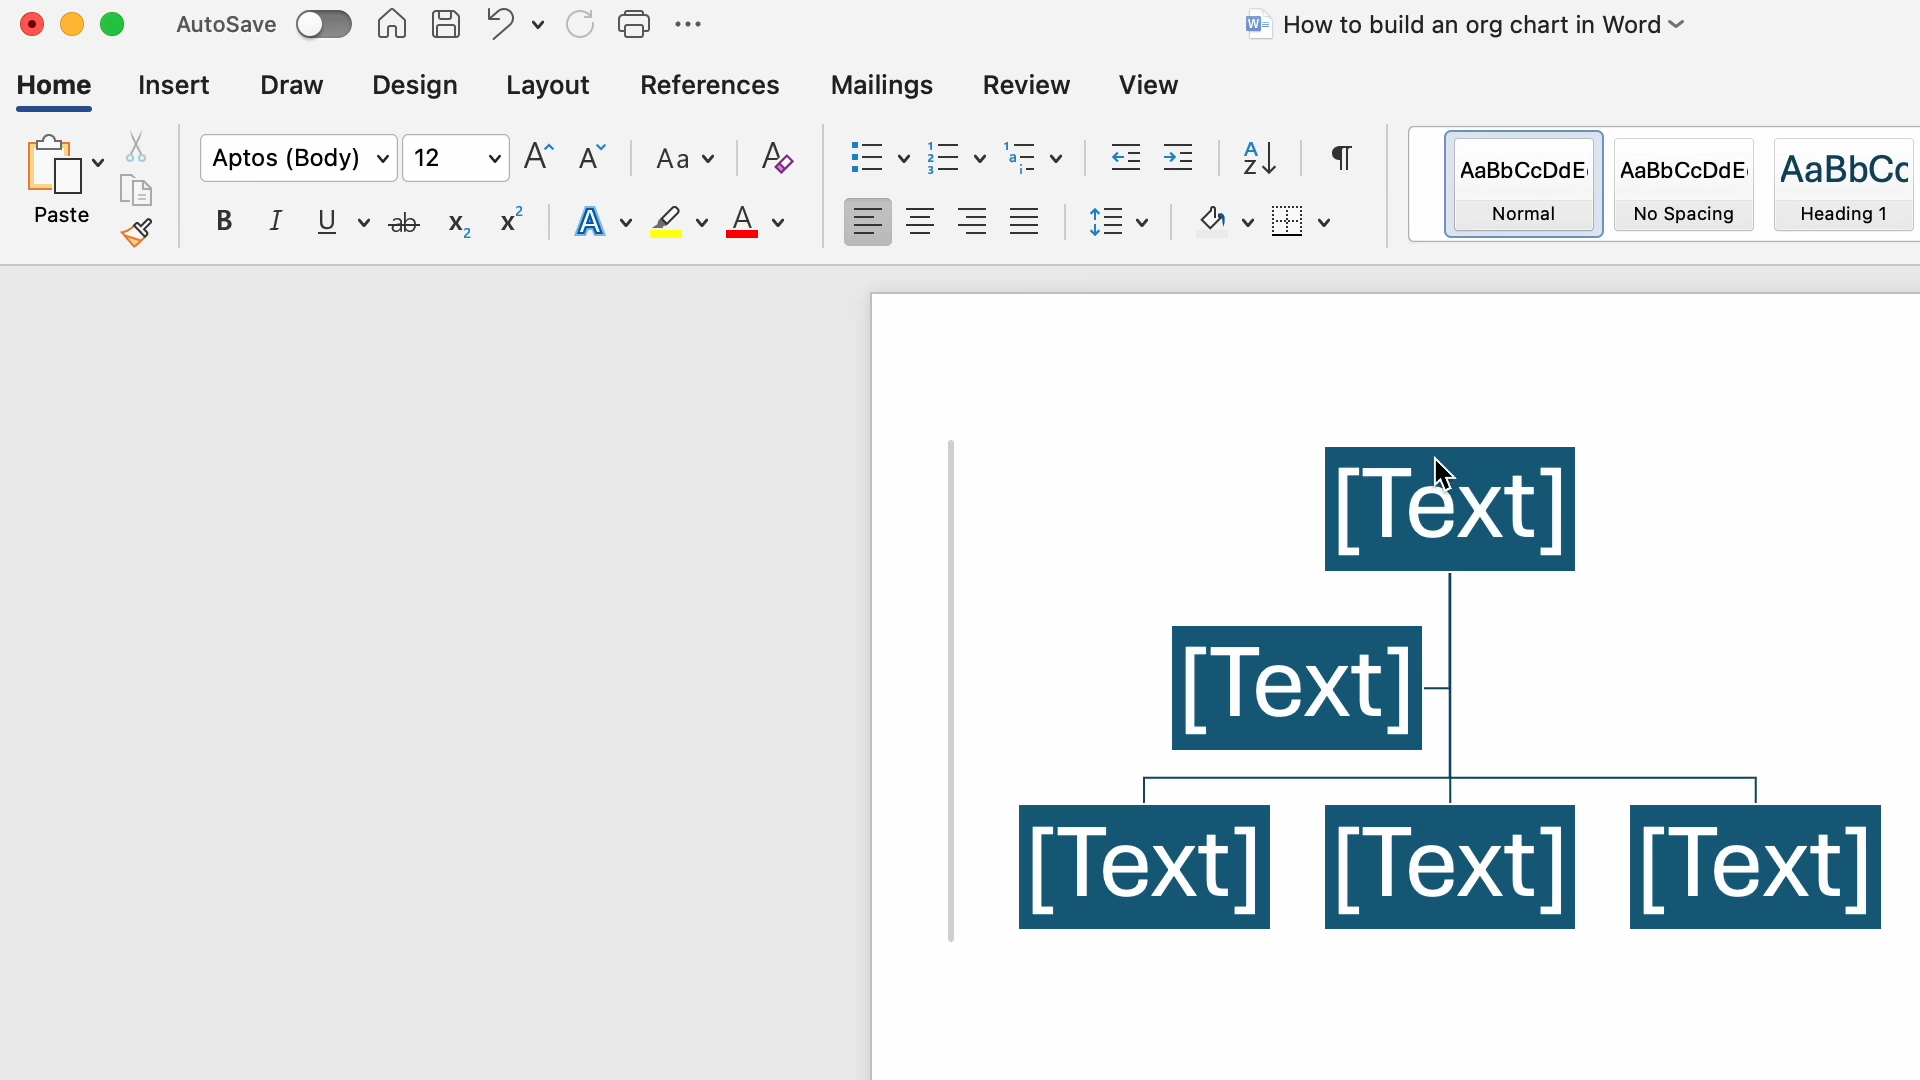
Step 4: Add text to your org chart
Once your chosen org chart template has been added to the doc, use the text pane to start typing names and positions. You can also click directly on the boxes in the org chart graphic to add text.
Step 5: Customize the chart structure
The default org chart on Word provides only 3 layers. You can add more layers and boxes by clicking on any box, right-clicking, and choosing Add Shape to add a box after, before, above, or below based on the structure you’re trying to create. You can also remove a box by clicking on the box and hitting delete on your keyboard.
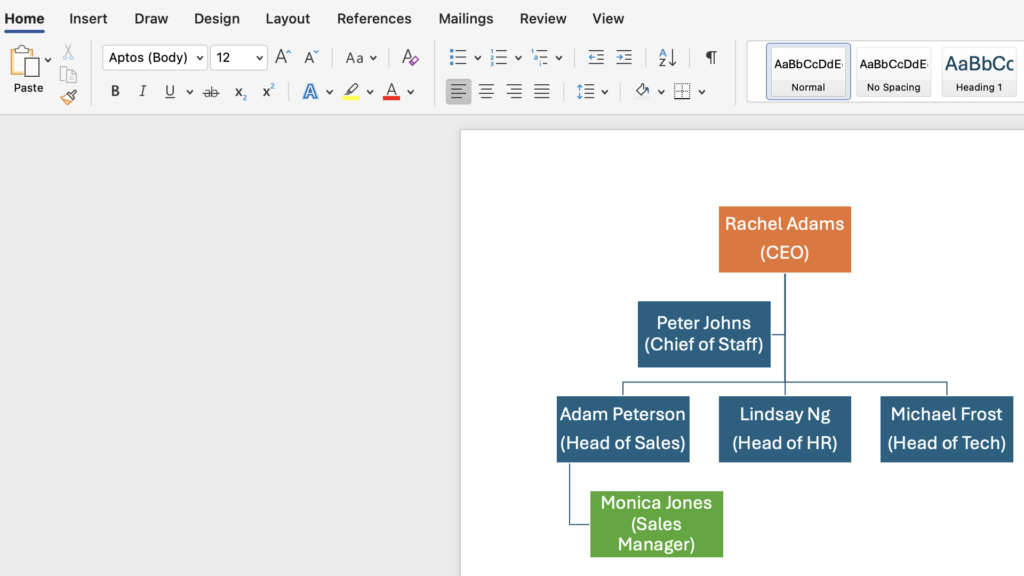
Step 6: Format your org chart
Word’s default org charts can be customized to match your company’s brand colors and font. Use the Format tab on the top bar to change your chart’s colors, styles, and layout. You can also change its size, text formatting, and alignment. Additionally, you can click on the borders or corners of your org chart to resize it so it fits within your document properly.

Step 7: Save your document
Once you’ve completed the org chart, save your document by clicking File > Save As so you can name and save your document.
Step 8: Review and edit as needed
Regularly review your org chart and make any adjustments or corrections in your layout or content to ensure you always have a version that’s up to date.
How to build an organizational chart in Excel
Creating an org chart in Excel is similar to the process of building it in Word. Here’s some step-by-step guidance to follow.
Step 1: Launch Microsoft Excel
Open Microsoft Excel into a new workbook or find an existing spreadsheet by clicking Find > Open and select the workbook in which you want to build the chart.
Step 2: Insert the org chart graphic
Click the Insert tab on the top bar and choose SmartArt. When you click on SmartArt, you’ll see a graphics menu. Choose the hierarchy category to see the types of organizational charts available, such as organizational charts and horizontal hierarchies. Choose the one you want and click OK. For our demo, we’ve chosen the Hierarchy List graphic to create a divisional org chart.
Step 3: Add your data
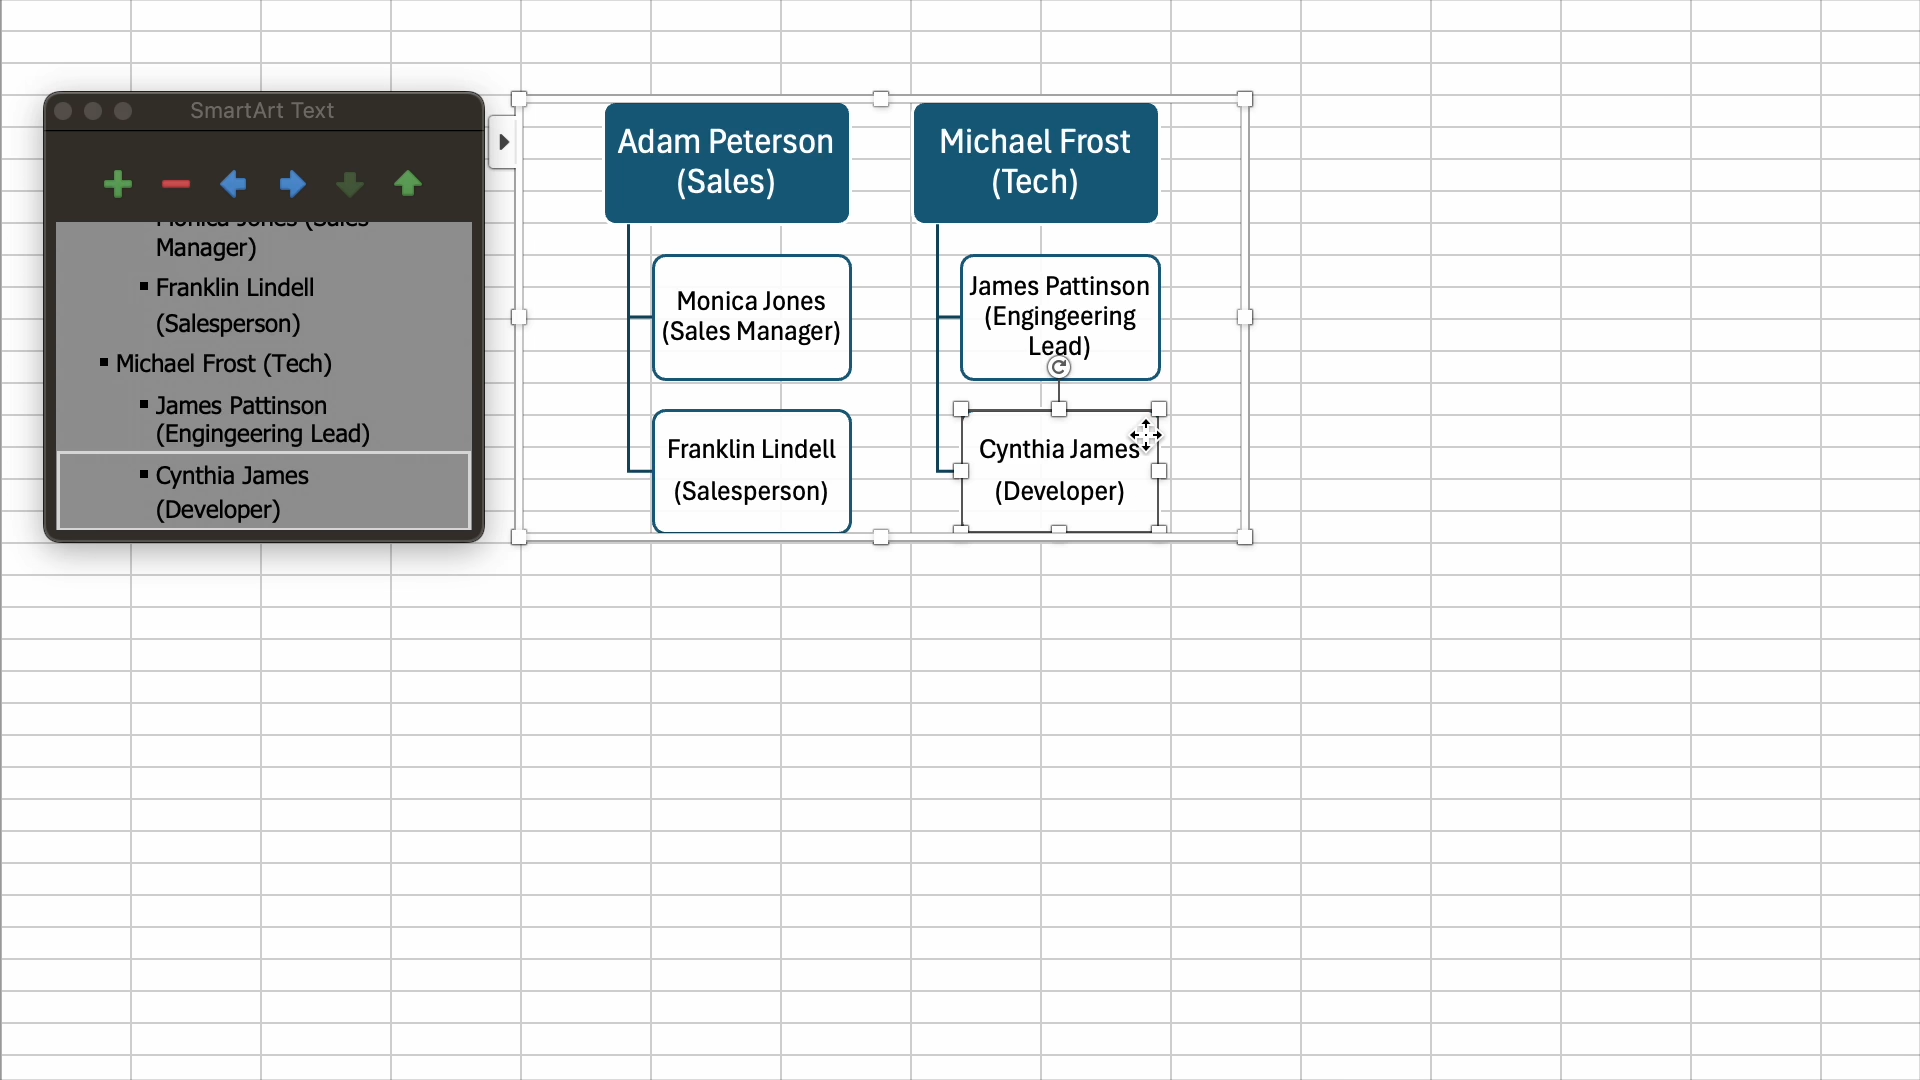
Use the text pane that appears alongside the org chart graph to enter the names and positions in your company. Alternatively, click directly into the boxes and begin typing.
Step 4: Modify the structure
You can add boxes to your chart by selecting a box, right-clicking, and choosing Add Shape. Then choose the relevant option, such as adding a shape after, before, above, or below—depending on how you want the hierarchy to appear. You can also delete a box by clicking on it and pressing delete on your keyboard.
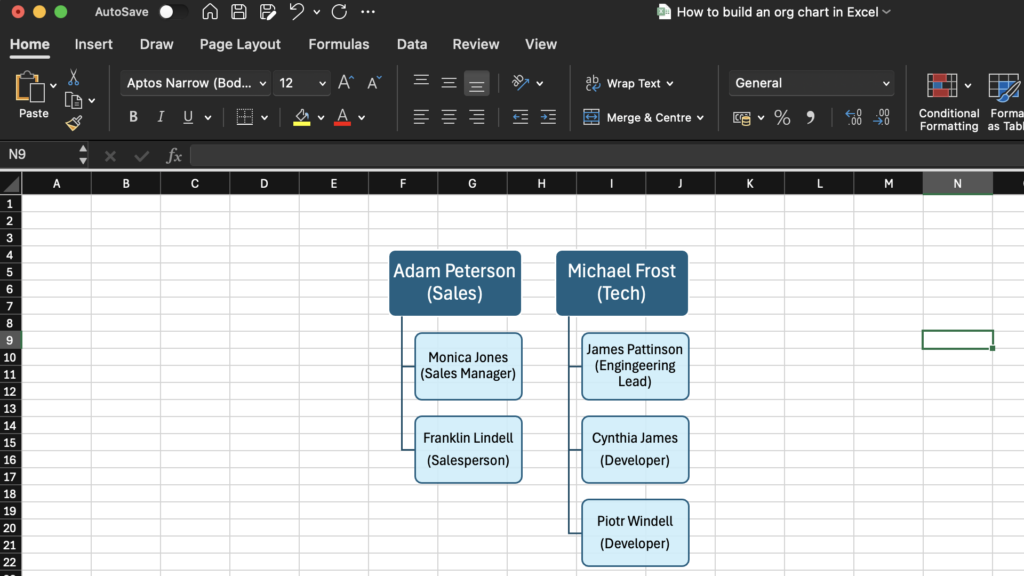
Step 5: Customize the appearance
Click on Format in your top bar to change the colors of the boxes, adjust the layout and alignment, and modify the text. You can also use the edges and corners of the graphic to resize the full org chart or drag it around to your desired position in the spreadsheet.
Step 6: Save your workbook
Once you’re happy with your org chart, click File > Save to name your workbook and save it in an appropriate location.
Step 7: Review and adjust
Keep your org chart current by periodically reviewing it or updating it in real time as you experience changes, such as employees joining, leaving, or being promoted.
This Might Interest You
Enjoyed learning how to build an organizational chart in Excel? You might also like our guide on how to create timesheets in Excel.
Challenges With Using Word and Excel To Create Org Charts
While Word and Excel are accessible and familiar, there are several downsides to using these tools for creating org charts.
- Limited org chart templates: With only a handful of org chart graphics, you can’t create a matrix chart with dotted lines unless you do this manually, which can be cumbersome and time-consuming.
- Viewing and formatting issues: Org charts often don’t fit well on a single page or look visually appealing in Word and Excel despite formatting them to align text and resize boxes.
- Limited scalability: Both Word and Excel pose issues in scaling large organizational charts, which can become finicky and difficult to manage as your company’s size and complexity grow.
- Manual updates: Since these org chart templates don’t link to dynamic databases, you’ll need to make manual adjustments for new hires, exits, promotions, and more.
- Version control issues: Maintaining version control on Word and Excel can be problematic, leading to multiple versions and potential confusion over the most current and accurate org chart.
The Best Way To Build an Organizational Chart Today
Above, we’ve covered how to build an organizational chart in Excel and Word, plus the challenges these traditional software pose.
Many companies have now turned to more modern, specialized software designed specifically for creating and managing company org charts.
For example, Connecteam—an all-in-one team management tool—has an automatic org chart tool among several other operations, communication, and HR features. Whenever you add or remove employees or change their roles, the chart adjusts itself, saving you time and reducing errors.
This Might Interest You
Discover the 5 best organizational chart software to learn more about Connecteam and other specialized org chart tools.
FAQs
How do you create an organizational chart?
Choose a tool like Word, Excel, or a specialized software like Connecteam. Select your org chart template of choice and enter your company’s employees, roles, and reporting relationships into the chart. Customize the design to reflect your company’s brand and ensure it’s updated regularly.
Which is the best org chart software?
Connecteam is the best all-in-one org chart software solution. In addition to its automatic org chart builder and user-friendly interface, it offers a powerful suite of work management tools, including an in-app chat, custom training feature, HR management, and more. Plus, it’s free for companies with fewer than 10 users.
Bottom Line on Building an Organizational Chart
Organizational charts help employees, managers, and HR understand the internal structure, lines of communication, and chain of command in a business. While many companies use Microsoft Word and Excel’s SmartArt feature to build their org charts, these platforms aren’t great for large org charts and must be updated manually for every change to your team.
The best way to avoid these problems is to use modern, specialized org chart software. Connecteam, for instance, automatically populates your company’s org chart as soon as you add, remove, or change employees’ roles. This helps save time and effort, reduces mistakes, and doesn’t present any issues with version control.
Like what you’re reading? Explore Connecteam’s features with a 14-day free trial.